반응형
출처: https://cointelegraph.com/news/price-analysis-2-10-btc-eth-bnb-xrp-ada-doge-matic-dot-ltc-avax
Price analysis 2/10: BTC, ETH, BNB, XRP, ADA, DOGE, MATIC, DOT, LTC, AVAX
The crypto market corrected as the SEC announced that staking as a service programs are illegal, and this has traders worried that regulators will turn the screw even further.
cointelegraph.com
cointelegraph.com에서 최근 주요 코인 가격을 분석한 내용이 있어 공부 합니다.
BTC/USDT
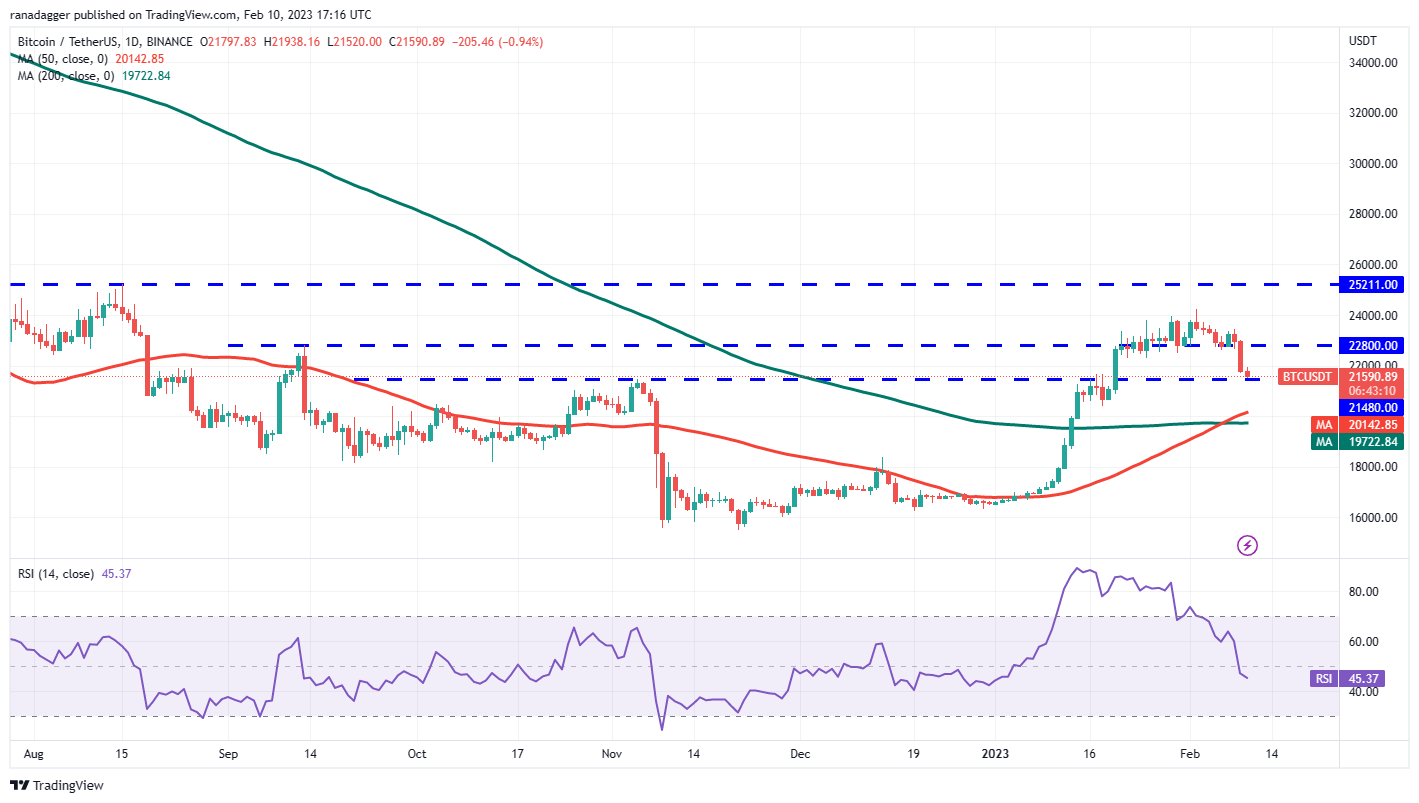
The $22,800 support cracked on Feb. 9 and Bitcoin plunged to the strong support near $21,480. A lack of a strong bounce off this level suggests that the correction may deepen further.

Below $21,480, the selling could accelerate and the BTC/USDT pair could fall to the moving averages. The relative strength index (RSI) has slipped into the negative territory, indicating that bears are trying to gain the upper hand in the near term.
The moving averages have completed a golden cross but the bulls need to flip the 200-day simple moving average ($19,722) into support if they want to remain in the game.
A strong rebound off the zone between $21,480 and the 200-day SMA will suggest that bulls are trying to form a higher low. The pair could then gradually move back toward $24,255. The bulls will have to surmount the $25,211 resistance to suggest that the downtrend is over
즉 약간의 조정은 예상된다, $19,722까지 가능하나, $21,480 가격대는 상당히 중요하다, (12일 현재 $21,865)
현 가격대가 유지 된다면, $24,255로 점진적으로 상승하고, 추가 상승의 힘을 모아 추세 전환하는 단계라고 분석함.
ETH/USDT
The bears did not allow Ether ETH $1,533 to sustain above the $1,680 level which may have tempted short-term bulls to book profits.

The moving averages have completed a golden cross, indicating a potential trend change but the bears are unlikely to give up without a fight. The sellers will try to pull the price below the moving averages and trap the aggressive bulls. If they can pull it off, the selling could intensify and a collapse to $1,200 is possible.
Instead, if the price turns up from the moving averages, it will indicate that bulls are trying to flip the 200-day SMA ($1,442) into support. The bulls will then make another attempt to thrust the price above $1,680 and gain control. The ETH/USDT pair could then start its northward march toward $2,000
$1,680을 강한 저항선이라고 판단하고 있습니다.
골든크로스에 추세전환가능성을 언급하고 있습니다. 그러나 쉽게 상승을 하지는 않을 것이다 라는 분석입니다.
하락한다면, 그 가격대는 $1,200까지 열려있습니다.
그러나, 상승전환을 한다면, $1,442 가격을 지지 할 것이며, 추가 상승은 $2,000까지 가능하다는 분석입니다.
DOT/USDT
The failure of the bulls to propel Polkadot DOT $6.27 above $7.25 may have attracted selling by short-term traders and that has pulled the price to the 200-day SMA ($6.33).

Buyers will try to arrest the decline in the zone between the moving averages and make this a higher low. If they succeed, it will suggest that the DOT/USDT pair has started a bottoming formation. A break and close above $7.25 could attract further buying and open the doors for a possible rally to $10.
On the contrary, if the price plummets below the 50-day SMA ($5.59), it will suggest that bears are back in control.
$7.25이상으로 상승하기는 쉽지 않네요. 200-day SMA가격인 $6.33 가격대까지 조정을 받을 가능성이 있음
만약 추가 상승한다면, .$10까지 상승랠리가 예상되나, 그렇지 않다면, 50-day SMA 가격대인 $5.59까지 하락할 가능성이 있습니다.
* 투자는 개인의 연구와 결정에 의해서 진행되어야 합니다
*좋아요 및 광고도 한번씩 둘러봐 주세요
반응형
'- 코인 투자 > - 코인 분석' 카테고리의 다른 글
| 폴카닷(DOT) 전망 (0) | 2024.03.10 |
|---|---|
| 1월 13일 김치 프리미엄 정리 (0) | 2024.01.13 |
| [22/6/17] 가상화폐 전망 및 낙폭 현황 정리 (0) | 2022.06.19 |
| [22/2/13] NFT economics 증권사 분석 보고서 (0) | 2022.02.13 |
| [22/1/22] 암호화폐 하락 원인 분석 (0) | 2022.01.22 |


